Google Analytics for Content Marketing a GA4 Playbook

Your content team is shipping. Blog posts go out every week. A new guide just launched. Social clips are pulling people back to the site. Traffic looks healthy, so everyone feels busy and vaguely successful.
Then the founder asks a simple question that turns the room quiet.
How many leads did the blog generate?
If your answer lives somewhere between GA4, a CRM, a Slack thread, and a spreadsheet named “final_v3_really_final,” you don't have a content measurement system. You have a pile of hints. That's the gap many organizations run into with Google Analytics for content marketing. They can see visits. They can see pageviews. They can even see conversions. But they can't cleanly isolate what content contributed, which pieces pulled people deeper into the funnel, and which assets deserve more budget.
Most guides stop at the All Pages report. That's where the trouble starts. If you want to prove content ROI, you need a setup that separates blog and resource performance from homepage, product, and campaign landing page noise. That means better events, better grouping, and reporting built around business questions instead of whatever GA4 shows by default.
Table of Contents
Stop Guessing and Start Measuring What Matters
The usual content reporting stack looks polished until someone asks for revenue. Then it falls apart fast.
A marketer opens GA4, filters for blog URLs, exports a CSV, checks form fills in another tab, and tries to stitch together a story. The story is never clean because content rarely gets the credit it deserves in a default analytics setup. Someone reads an article, leaves, comes back through branded search, and books a demo. The demo gets credited to the later touchpoint. The article that created the interest often disappears from the conversation.
That's a serious problem because content isn't a side project. Content marketing generates 3 times more leads than outbound marketing methods while costing 62% less, yet only 31% of marketers effectively measure revenue attribution, according to Digital Applied's 2026 content marketing data roundup. Teams are doing the work, but many still can't prove the business result.
The real issue is the attribution gap
GA4 gives you data. It doesn't give you a finished measurement strategy.
If you leave the platform on default settings, content gets blended into sitewide reporting. Blog posts, feature pages, docs, and homepage traffic all sit in the same bucket unless you separate them. That means your “top converting pages” report often tells you more about navigation structure than content effectiveness.
Practical rule: If your report includes the homepage and blog posts in the same table, you're not measuring content. You're measuring the whole website.
This is why content teams keep overvaluing last-click channels and undervaluing educational assets. The first visit matters. The return visit matters. The CTA inside the article matters. But default reporting rarely presents those connections in a way a founder or revenue leader can use.
Better measurement changes content decisions
Once you can isolate content-led sessions and content-led conversions, the conversation gets sharper.
You stop asking, “Which post got the most traffic?”
You start asking:
Which article introduced visitors who later became leads
Which topic cluster drives engaged sessions but weak CTA response
Which content format deserves another quarter of production
Which posts need stronger internal links or better offers
That's what Google Analytics for content marketing should do. Not flood you with charts. Give you a system for connecting content actions to revenue actions.
Define Your Content Goals and KPIs in GA4
A lot of bad GA4 setups start with a technical mistake that looks harmless. The team installs tracking before agreeing on what content is supposed to accomplish.
That creates a dashboard full of activity and no decision-making value. If your content goal is lead generation, then “users” and “views” can't be the headline metrics. They're context, not proof.

For startup teams building a serious content engine, this matters even more. If you need a broader strategy lens before wiring KPIs into GA4, this guide on content marketing for startups is a useful companion.
Start with the business outcome
Every content program should map to one of three business jobs:
Create demand
Educational posts, thought leadership, and SEO pages often live here. Their job is to attract the right audience and move them into an engaged state.Capture demand
Comparison pages, webinars, templates, and product-adjacent resources often help here. Their job is to convert attention into a lead or trial.Support retention and expansion
Help content, customer education, and use-case articles work here. Their job is to keep existing users active and moving toward deeper value.
If you skip this step, your GA4 property turns into a junk drawer. You'll track everything because everything feels potentially useful.
Split macro and micro conversions
In content measurement, not every conversion should be treated the same.
A macro-conversion is the business outcome you care about most. That might be a purchase, booked demo, qualified lead submission, or trial start.
A micro-conversion is the content action that signals forward movement. That might include:
Newsletter signup from a blog post
Template download from a resource page
CTA click inside an article
Visit to a pricing page after consuming content
Sign-up for a webinar from an educational page
Both matter. Macro-conversions tell you whether content drives revenue. Micro-conversions tell you where content creates momentum before revenue happens.
Track both, but don't mix them. A dashboard that treats “scroll” and “purchase” as equal wins will mislead you.
Choose KPIs that can survive a leadership meeting
Good content KPIs answer a business question without a long explanation.
For brand awareness, useful GA4 indicators include engaged sessions per user and new users. For lead generation, form submissions and key CTA clicks matter more. For retention, repeat purchases or customer value metrics matter if your stack supports them.
What matters is alignment. A top-of-funnel article can be doing its job even if it doesn't close the sale on the first visit. But it still needs a measurable handoff to the next step.
Here's where GA4 becomes more than a reporting layer. In 2026, Shopify merchants using GA4's predictive purchase probability feature reported an average 14% improvement in return on ad spend, according to Amra & Elma's GA4 adoption analysis. That's a reminder that the platform can support revenue decisions when the setup goes beyond surface-level traffic reporting.
Configure Your GA4 Tracking Machine
A clean reporting layer starts with boring discipline. Most content measurement problems don't come from GA4 being weak. They come from sloppy implementation.
If traffic sources are mislabeled, events are inconsistent, and blog posts aren't grouped properly, the reporting will be unreliable no matter how pretty the dashboard looks.
Lock down UTMs before you touch reports
UTMs are still the foundation for clean campaign attribution. If your team uses five naming styles for LinkedIn, you don't have channel reporting. You have a taxonomy crime scene.
Use one convention and enforce it across email, paid social, partnerships, influencer links, and owned promotion. If privacy and attribution quality are already creating headaches, this walkthrough on consent mode v2 recovery and implementation is worth reviewing alongside your GA4 cleanup.
Parameter | Purpose | Example |
|---|---|---|
utm_source | Identifies where the click came from | |
utm_medium | Identifies the channel type | paid-social |
utm_campaign | Groups links under one campaign name | q3_ai_guide |
utm_content | Differentiates creative or placement | carousel_ad_a |
utm_term | Captures keyword or audience label if needed | content_marketing |
A few rules keep this usable:
Stay lowercase: GA4 treats variations like separate values.
Avoid improvisation: Pick one channel naming style and document it.
Name for reporting: If a founder can't understand the campaign name in a dashboard, rename it now, not later.
Use events that match real content behavior
GA4 is event-based. That's the whole game.
Instead of treating content as a passive pageview, you want to capture what visitors do on content pages. GA4 already helps here. It automatically tracks unique user scrolls at 90% depth and replaces bounce rate with engagement rate, which makes it easier to connect content interaction to conversion setup, as explained by the University of Minnesota on using GA4 for content performance measurement.
That default scroll event is useful, but it isn't enough on its own. Add events that reflect deliberate reader intent.
Events worth configuring for content
CTA clicks inside articles
Track clicks on buttons like “Book a demo,” “Start free trial,” or “Download guide” when they occur within blog or resource templates.Inline form submissions
If a post contains an embedded signup form, give that submission a distinct event name so it doesn't blend into sitewide forms.Content asset downloads
Track downloads for templates, checklists, whitepapers, and gated resources with clear event labels.Internal pathing events
Track clicks from blog posts to pricing, product, or demo pages. These often signal stronger intent than the original pageview.
A simple naming structure keeps things sane. Use event names that describe the action and location, such as blog_cta_click, resource_download, or newsletter_signup_blog.
Don't create ten near-identical events for the same action. One clean event with useful parameters beats a pile of fragmented names.
Build content groups people can actually use
This is the part many teams skip, and then they wonder why their reports are messy.
You need a grouping system that reflects how your content strategy works. Not how your CMS happens to structure URLs.
Useful content groups often include:
By section
Blog, resources, case studies, webinars, docsBy topic cluster
Analytics, onboarding, CRM, paid acquisition, SEOBy intent stage
Awareness, consideration, decision, customer educationBy format
Article, template, guide, checklist, video landing page
If your company publishes at any scale, grouping by URL alone gets clumsy fast. Topic cluster and format usually produce more useful reporting than raw page path tables.
A practical setup often looks like this:
Map URL patterns to content types
Add content metadata where possible
Pass those values into GA4 through GTM
Validate the values in DebugView
Use the same labels in Looker Studio later
When this machine is configured properly, content reporting stops being a scavenger hunt. You can filter by blog posts only, compare topic clusters, and isolate content-generated actions without dragging homepage traffic into every report.
Build Your Content Mission Control Dashboard
The default GA4 interface is good for exploration. It's not where many content marketing teams should run weekly content reviews.
If you rely on the All Pages report, you'll keep getting half-answers. Blog articles sit next to product pages. Navigation pages inflate conversions. A homepage redesign can make your content numbers look better or worse even when the blog itself hasn't changed.

That's exactly why custom reporting matters. Only 8% of GA4 tutorials provide step-by-step instructions for setting up content-grouped conversion tracking, according to Orbit Media's analysis of content measurement guidance. Most tutorials stop before the useful part.
If you've ever looked at a marketing dashboard and felt it was technically accurate but strategically useless, this breakdown of the marketing metrics that actually matter in 2026) will feel familiar.
Why the All Pages report keeps lying to you
It isn't malicious. It's just broad.
The report answers, “What pages on this website got activity?” It does not answer, “What content caused business movement?”
For that, you need reporting with filters and segments that isolate content inventory only. The dashboard should answer questions like:
Which blog posts generated newsletter signups
Which topic clusters assist trial starts
Which content formats produce the strongest engagement rate
Which channels bring visitors who engage with educational content
Which content paths lead people toward pricing or demo pages
What your dashboard should include
A useful Looker Studio dashboard for content usually has a few layers, not one giant page.
1. Executive summary
Keep this high-level and clean. Include:
Content sessions
Engaged sessions from content
Content-originated conversions
Top converting content groups
Top traffic sources to content
This page is for leadership. They want direction, not twelve filter controls.
2. Content performance table
This is your working report. Use a table with dimensions such as page path, content group, or topic cluster, then add metrics like engagement rate, key event count, and conversion-related actions.
Filter this table so it only includes blog and resource content. Exclude homepage, login, pricing, and product URLs unless your content strategy explicitly includes them.
3. Assisted path view
Content gets some overdue credit. Show readers which pages tend to appear before a conversion path deepens. You won't get perfect truth from GA4 alone, but you can get a much cleaner picture than a pageview leaderboard.
A good dashboard teaches the team where content opens doors, not just where it closes deals.
Here's a walkthrough that can help when you're wiring the reporting layer:
How to isolate direct content contribution
This is the part many content teams need.
Create a content-only segment or filter using page path or content group. Then build your conversion reporting around visits and events that start from, include, or occur within that content set.
A practical approach:
Define the content universe
Example: URLs containing/blog/or/resources/, or a content_group dimension passed through GTM.Create content-specific key events
Use event names that identify conversion actions happening on content pages, such as a blog signup or in-article CTA click.Separate direct from blended conversions
Direct content contribution usually means the conversion happened during a content session or from a content page. Blended site conversions should live in a different report.Visualize by content group and landing page
This reveals whether a topic cluster attracts qualified attention or just cheap clicks.
If your dashboard can't exclude non-content traffic, it can't prove content ROI.
That one change usually shifts the entire discussion. Instead of defending content with vague influence language, you can show which assets create measurable movement and which ones are just taking up index space.
Create Your Content Optimization Cadence
A dashboard without a review rhythm becomes office decor. Teams admire it, maybe screenshot it, then go back to publishing on instinct.
Useful Google Analytics for content marketing depends on cadence. Weekly reviews catch friction early. Monthly reviews tell you where to invest, refresh, merge, or retire content.
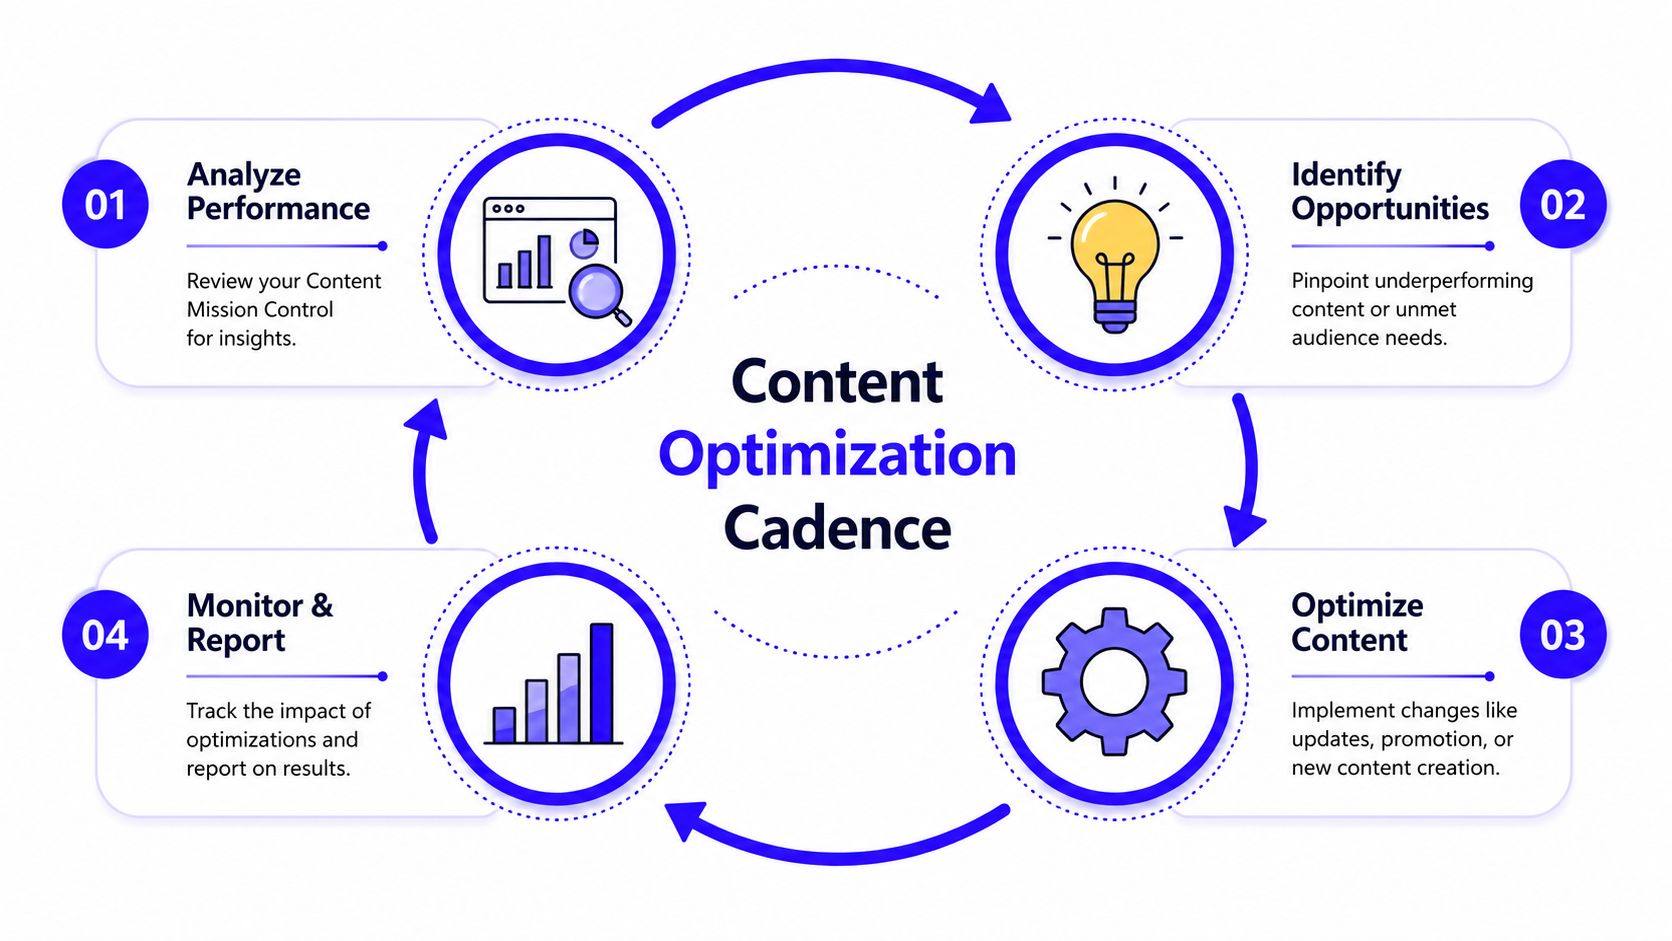
Run a weekly triage
Start with a short list of pages, not the whole library. Pull top content by entrances, engaged sessions, and content-specific conversion actions.
Then review by pattern.
When traffic is strong but engagement is weak
A post is ranking or getting distributed, but readers aren't sticking.
The first suspects are usually:
Mismatch between headline and page intent
Slow or awkward mobile experience
Weak intro that delays the payoff
Poor internal linking to the next relevant step
The benchmark helps ground this review. The median GA4 engagement rate across industries is 56.21%, and falling below relevant benchmarks often points to mismatched landing page intent or technical SEO issues, according to Databox's GA4 engagement benchmark analysis.
If a post is well below your category norm, don't rewrite the whole piece first. Fix the obvious friction. Tighten the opening. Improve load behavior. Move the CTA closer to the point where the reader's question gets answered.
When engagement is healthy but conversions are flat
This usually means the content is good, but the handoff is wrong.
The page may be attracting the right audience while offering the wrong next step. A high-intent article shouldn't end with a vague newsletter box if the reader is ready for a template, demo, checklist, or product walkthrough.
Good content can still fail commercially when the CTA belongs to a different stage of intent.
Use monthly reviews to decide what to scale
Monthly review is where you categorize your library. I like three buckets because they force action.
Bucket | What it means | What to do |
|---|---|---|
Winners | Strong engagement and meaningful business actions | Update, repromote, build related content |
Underperformers | Some signal exists, but conversion or engagement is weak | Improve intent match, CTA, internal links, or on-page structure |
Zombies | Little engagement, little business impact, no strategic reason to keep as-is | Consolidate, redirect, rewrite, or remove |
This is also where topic-level patterns become useful. One cluster may produce lots of engaged sessions but weak commercial movement. Another may attract less traffic but drive stronger lead quality. The second cluster usually deserves more attention than the first.
A practical monthly agenda looks like this:
Review top and bottom content groups
Compare performance by format
Check whether content-led CTAs match article intent
Flag pages for refresh, merge, or retirement
Report insights in plain language, not analytics jargon
You're not trying to create a museum of metrics. You're building a publishing system that gets smarter over time.
From Pageviews to Profit
Pageviews are easy to collect and easy to misuse. They tell you something happened. They don't tell you whether the thing mattered.
The shift that makes Google Analytics for content marketing useful is simple. Stop treating content as a publishing activity and start treating it as part of the revenue system. That means defining business outcomes first, configuring events around real reader behavior, grouping content in a way your team can analyze, and building dashboards that isolate content instead of blending it into the whole site.
When that system is in place, content becomes easier to manage. You can see which posts introduce qualified visitors, which clusters earn deeper engagement, which CTAs deserve replacement, and which assets are helping the pipeline even if they never win a last-click report.
That's the part many teams miss. Better measurement doesn't just help you justify content after the fact. It changes what you publish next.
Take control of the setup, and the strategy gets sharper fast.
If you want a hands-on partner to clean up GA4, build content-specific dashboards, and connect your marketing data to actual revenue, Du Marketing helps startups turn messy attribution into decision-ready reporting.