Click Rate vs Click Through Rate: Startup Guide 2026

Your paid dashboard says one thing. Your email report says another. GA4 shows a different number again, and suddenly the same campaign feels like three separate arguments with no winner.
That's usually the moment founders start asking the wrong question. The useful question isn't “why are the numbers different?” It's “which denominator am I measuring?” In click rate vs click through rate, the denominator is the whole game, because it decides whether you're looking at delivery efficiency, audience engagement, or post-open behavior.
Metric | What it measures | Denominator | Best used for | Typical place it appears |
|---|---|---|---|---|
Click rate | Clicks against delivered audience | Delivered emails or delivered messages | Campaign-level delivery to click performance | Email platforms |
Click-through rate | Clicks against people who saw the message | Opens, impressions, or views | Creative and engagement efficiency | Ads, some email reports, analytics dashboards |
The trap is that most tools present both as if they're interchangeable. They aren't, and when startup teams mix them up, they end up optimizing the wrong layer of the funnel.
Table of Contents
The Two Numbers That Look the Same but Aren't
A founder opens Looker Studio before standup and sees one campaign with three “click” numbers. Google Ads says the ads pulled clicks. HubSpot shows email clicks. GA4 shows sessions that don't match either. Nobody is lying, but the dashboards are still fighting.
That confusion starts with the denominator. One tool is measuring clicks against exposure, another is measuring clicks against delivery, and a third is measuring what survived the tracking chain and landed in analytics. The same word, clicks, gets attached to different questions, so the number looks familiar while the meaning shifts underneath it.
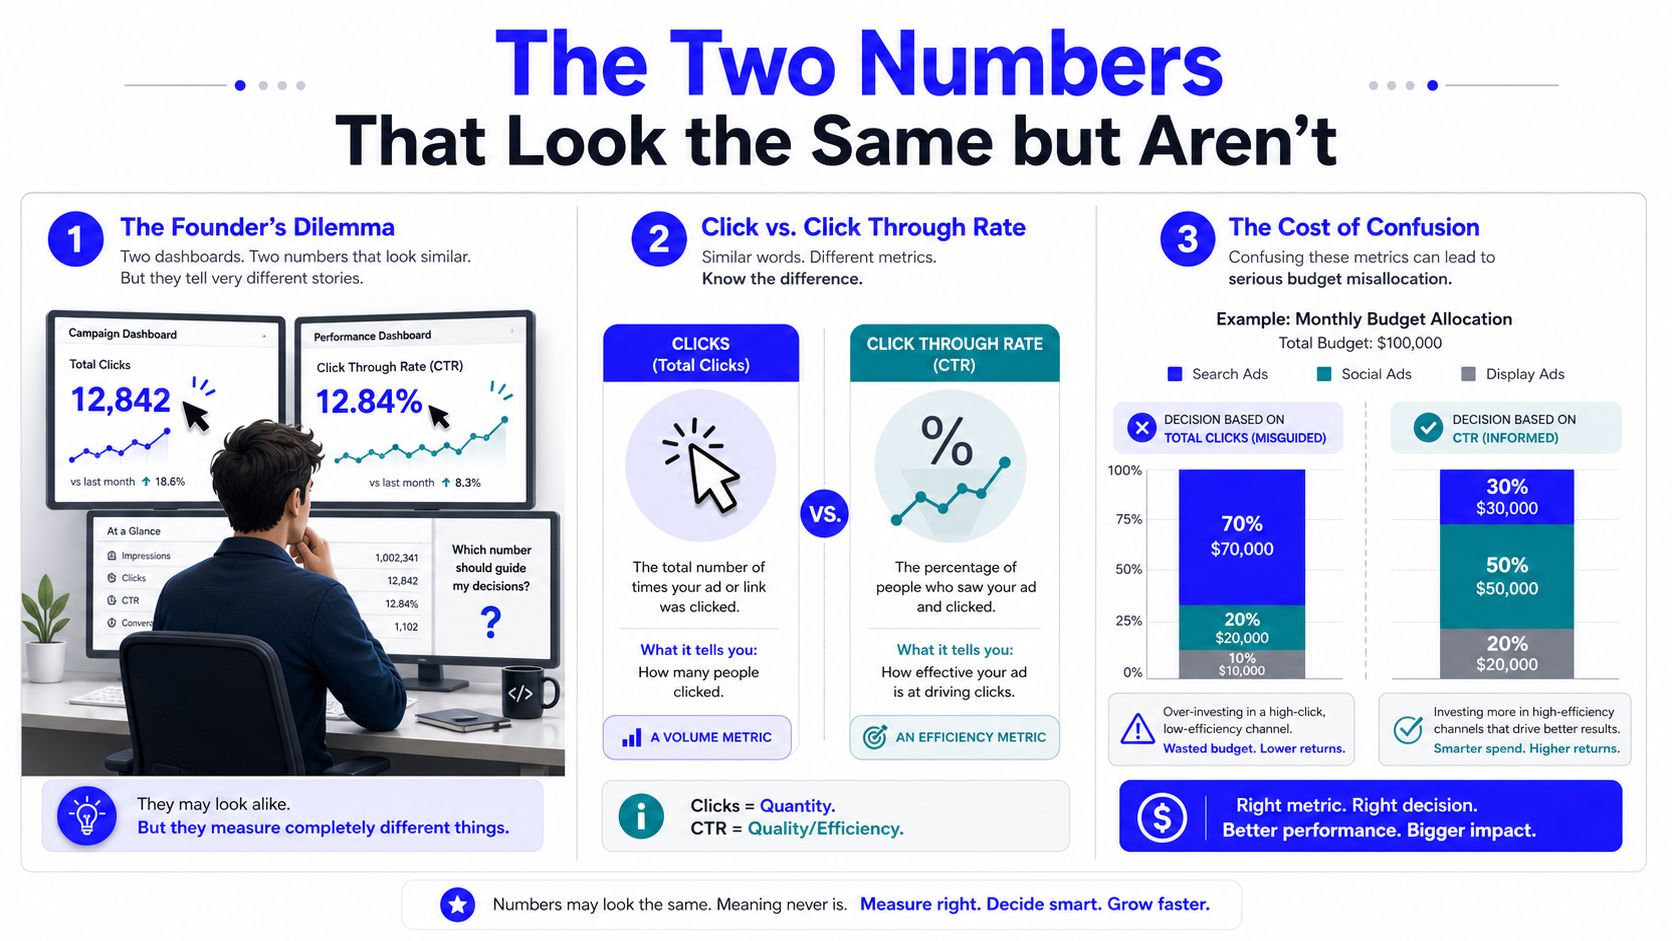
What the mismatch usually means
When the click numbers diverge, the problem is often not the campaign. It's the reporting layer. A clean ad platform click can disappear in analytics if the session never gets attributed correctly, and a CRM click can look inflated if the email tool counts repeated interactions differently from the ad platform.
Practical rule: if two dashboards use different denominators, don't compare the raw numbers until you've confirmed what each one calls the denominator.
That's why this debate matters in early-stage SaaS. A team can spend a week arguing about performance when the core issue is that one person is reading delivery-to-click behavior and another is reading seen-to-click behavior. Once you realize that, the gap between the numbers becomes a diagnostic clue instead of a morale problem.
The cleanest mental model is simple. Click rate is usually the better operational number for message delivery. CTR is usually the better engagement number for the thing people saw. If those two are drifting apart badly, the next question isn't “which team messed up?” It's “where did the measurement chain change?”
Definitions and Formulas You Can Reuse Today
A clean way to keep this straight is to start with the denominator, because that is where the meaning changes. Click rate measures clicks divided by delivered messages or delivered audience. Click-through rate measures clicks divided by opens in email, or by impressions in paid media. For a deeper dive into tracking, see our guide on Google Analytics for content marketing.
In advertising, Google Ads defines CTR as clicks divided by impressions, and its help page uses the simple example of 5 clicks from 100 impressions to show a 5% CTR. That framing matters because CTR is built to show how often people who saw an ad clicked it, which is why paid teams use it for optimization and A/B testing. Google's benchmark context also shows why the number needs channel context, since search and display behave very differently. Google Ads CTR definition and benchmark context
Email reporting draws the line differently. HubSpot's explanation separates click rate as clicks against delivered emails and click-through rate as clicks against opened emails. A tracking guide makes the same practical point: click rate is the delivery-to-click metric, while CTR is the open-to-click metric, so the two can move in different directions even when the same send drives both. HubSpot's click rate and CTR distinction, Trackingplan's explanation of the denominator choice
A simple example shows why this matters in reporting. Send 1,000 emails, 400 are opened, and 80 are clicked. Your click rate is 8% because 80 of 1,000 delivered messages produced clicks. Your CTR is 20% because 80 of 400 opens produced clicks. The send did not change, but the denominator did, so the story changed with it.
When a startup team sees numbers like that, the useful question is not which dashboard is right. It is which denominator answers the business question being asked. Delivery-to-click tells you whether the audience acted after the message reached them. Open-to-click tells you whether the message earned the click once it was seen. If those two rates diverge, the gap usually points to a reporting choice, a creative issue, or a problem earlier in the funnel.
How Each Channel Measures Clicks Differently
Different channels force different answers, and that's why the same campaign can produce multiple “truths” at once. Paid search and paid social usually default to CTR against impressions. Email tools often show both click rate against delivered emails and CTR against opens. Organic and analytics tools can muddy the water further because they're often counting downstream sessions, not the click event itself.
In Google Ads, CTR is built around impressions, not delivery or opens. That's why a search campaign can look healthy on CTR even before anyone lands on the page. In email, the reporting split is more explicit, because the platform can show both the click rate against delivered emails and the CTR against opens in the same report. That's useful, but it also tempts teams to compare the wrong columns like they're interchangeable.
Where the defaults quietly differ
Meta and LinkedIn also tend to expose CTR as an impression-based efficiency metric, which makes sense for feed-based inventory. Email platforms split the metric because the message has two distinct exposure moments, delivery and open. GA4 sits even further downstream and only cares if the click led to a measurable session or event chain.
That's why the dashboard mismatch doesn't necessarily mean the campaign underperformed. It usually means the platforms are answering different operational questions. Search is asking whether the ad earned attention in auction and view. Email is asking whether the message earned a click after delivery. Analytics is asking whether the click survived the journey into tracked behavior.
If you've ever wondered why a campaign can look good in Ads Manager, decent in HubSpot, and weak in GA4, that's the reason. The numbers are not contradicting each other. They're measuring different choke points in the journey.
Here's the discipline that keeps the report honest.
Use impression-based CTR when the question is whether the creative won attention in a crowded feed or search results page.
Use delivery-based click rate when the question is whether the message earned a response from the audience you reached.
Use analytics downstream events when the question is whether the click turned into anything useful.
For a deeper look at how paid channels fit into the system, the paid media breakdown from Du Marketing is a useful companion read.
The key is not picking one “best” metric forever. It's matching the denominator to the decision you're about to make.
When a Rising CTR Hides a Falling Pipeline
A higher CTR can absolutely make the business worse. That sounds backwards until you've watched cheap clicks flood a campaign with curiosity traffic that never had a serious chance of buying. The platform celebrates the click, the founder celebrates the lift, and the pipeline complains later.
The benchmark gap between search and display tells part of the story. CXL's benchmark page cites average CTR of 6.64% for search and 0.57% for display. That doesn't mean search is always better revenue-wise. It means search often captures more explicit intent, while display can generate attention without much purchase pressure. CXL CTR benchmarks
Why the click can be a trap
Clicks are cheap to optimize for because they happen early. Conversion quality shows up later, after the user has endured the landing page, the form, the offer, and the follow-up. If the ad system can buy more clicks by broadening the audience, it often will, and that can raise CTR while lowering the quality of the traffic.
That's why the key question is not “Did CTR improve?” It's “Did CTR improve the parts of the funnel that matter?” If conversion rate stays flat or drops, a nicer CTR is just a prettier top of funnel. If CAC gets worse, the dashboard reward was fake.
Trigger question: when does a CTR win stop mattering because conversion rate is the real bottleneck?
Use that question in weekly reviews. If the landing page is weak, no amount of click polishing saves it. If the audience is wrong, more clicks only speed up the waste. If the offer is strong but the ad is dull, then CTR work has a real job to do.
The practical sequence is simple. Read CTR, conversion rate, and CAC together. If CTR rises and conversions rise too, keep going. If CTR rises while conversions stay flat, the ad may be attracting the wrong curiosity. If CTR falls but conversions improve, you may have made the audience more selective.
That's the part often overlooked. A lower CTR isn't automatically a bad sign. Sometimes it's the cleanup that protects the pipeline.
Attribution Pitfalls That Distort Both Metrics
Clicks get messy the moment they leave the platform that counted them. GA4 can model or miss behavior depending on how the session is stitched together. Server-side tagging changes what gets observed in the browser. Meta CAPI can send events more directly than browser-only tracking. UTMs can break the handoff. CRM sync can lag behind the click by hours or days.
The result is a familiar startup headache. Google Ads reports a click, HubSpot shows an email interaction, and GA4 either fails to connect the session or assigns it somewhere unexpected. Nobody intentionally misreported the result. The pipeline between tools just wasn't clean enough to preserve the same event identity from start to finish.
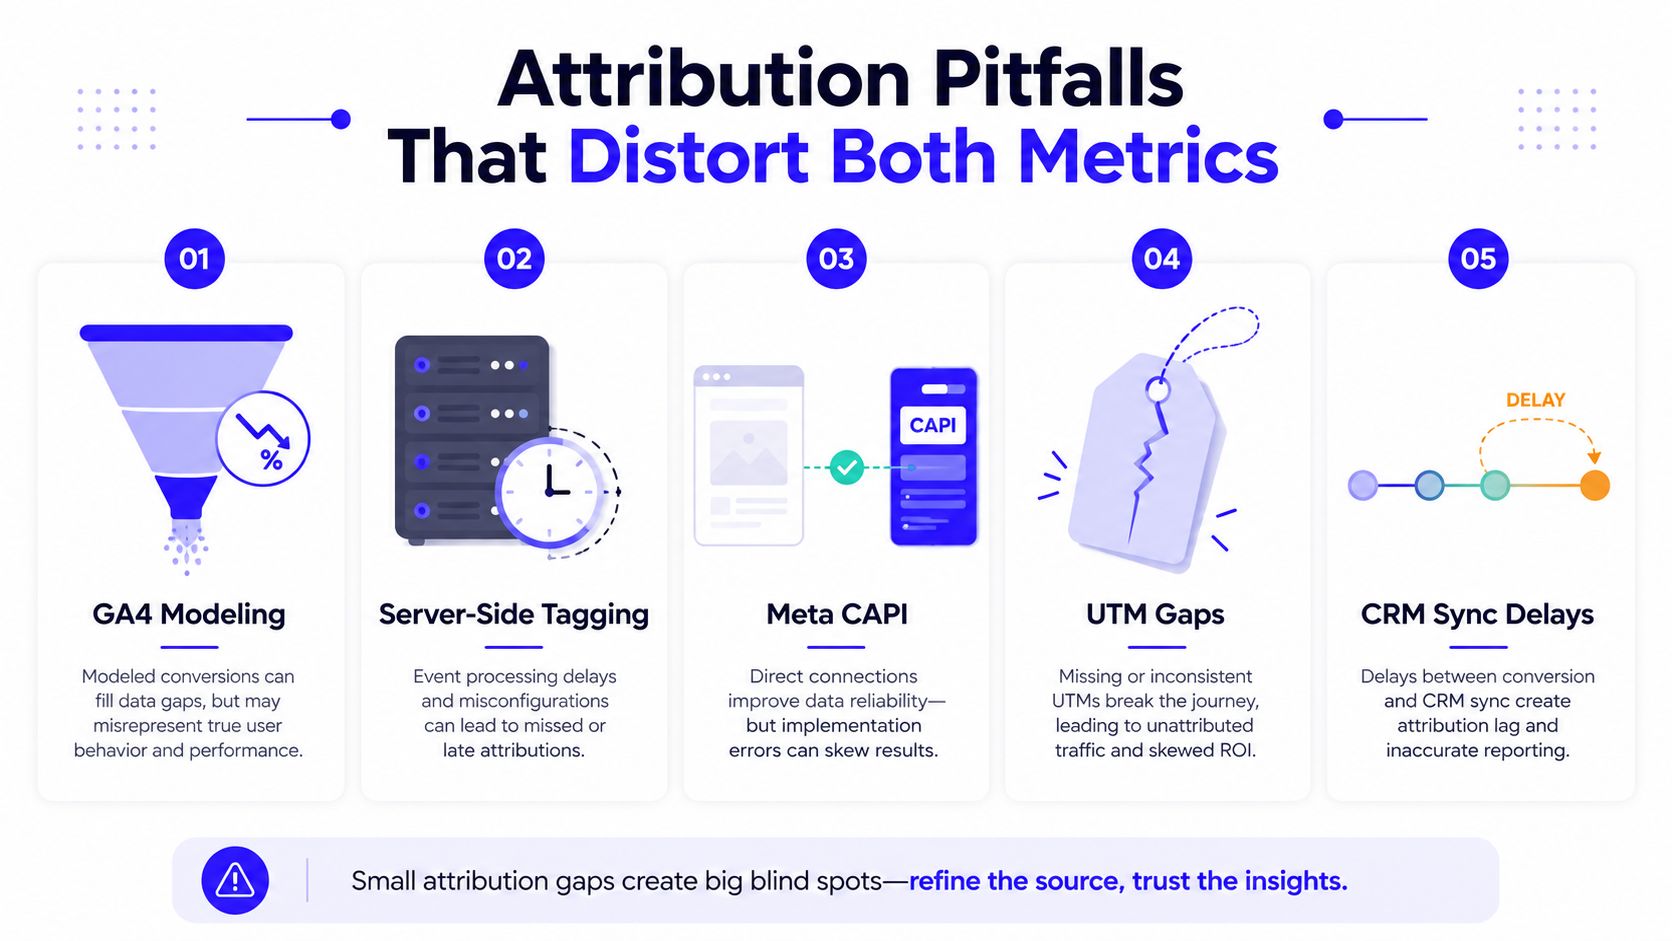
Where startup stacks usually break
GA4 is the first place teams notice the problem, because it's downstream from the ad click and the email click. If the browser blocks tracking, consent settings interfere, or the landing page tags are incomplete, the click can exist in the source platform but never fully materialize in analytics. That makes the metric look inconsistent even when the traffic was real.
Server-side tagging helps because it reduces dependence on browser-only collection. Meta CAPI does something similar for the ad platform by sending conversion events more directly. Neither one magically fixes bad UTMs or a messy CRM, but both reduce the amount of data that gets lost between the click and the sale.
Clicks without conversion data are decorative. They look good until someone asks what they bought.
That's why the CRM matters so much. If the lead enters the system but syncs late, gets duplicated, or arrives without the campaign source intact, the click may never be tied back to pipeline. Once that happens, you can't trust the metric as a revenue signal, only as an isolated interaction count.
The mental model is straightforward. The source platform counts the click. GA4 tries to reconstruct the session. The CRM tries to connect the person to revenue. If those three layers don't agree, your click rate and CTR may still be mathematically correct, but strategically incomplete.
Reporting Setup a Solo Operator Can Trust
A reporting stack only works if the inputs are boring. That means one UTM naming convention, one tagging standard, one CRM source field strategy, and one dashboard that shows clicks beside conversion rate and CAC instead of letting clicks sit on a pedestal by themselves. When those pieces are standardized, the numbers stop drifting as much, and review meetings get shorter.

What to standardize first
Start with UTMs. If campaign names, source labels, or content tags are inconsistent, every downstream report gets contaminated. Then make sure GTM is firing the right events and that server-side tagging is capturing what browser-only tracking misses when possible. The marketing reporting automation guide is a useful reference if you're trying to tighten the whole handoff without turning your stack into a science project.
CRM hygiene comes next. Leads need to carry source, campaign, and lifecycle state in a way that survives sync delays. If your email tool, ad platform, and CRM each use different naming conventions, you'll spend half your week reconciling phantom discrepancies that never should have existed.
A solo operator should QA the stack on two rhythms.
Weekly QA: check UTM integrity, confirm that top campaigns are tagged correctly, and spot obvious gaps between platform clicks and downstream sessions.
Monthly QA: test the full source-to-revenue path, compare source platform clicks with CRM leads, and review whether any campaign names or lifecycle stages have drifted.
The goal is not perfect identity across every tool. That rarely happens. The goal is reliable enough consistency that you can trust the direction of the trend and act on it. If the dashboard says click rate dropped but conversions held, you need enough confidence to make the right call instead of questioning the plumbing for three days.
Benchmarks and Optimization Moves That Actually Move Revenue
Benchmarks matter only when they point to a decision. A strong search CTR with weak conversions usually means the friction sits after the click. Low email click rate with decent open-to-click behavior often means the message is doing its job, but the list is losing interest. Healthy-looking display CTR with poor pipeline quality means the ad is easy to click, not worth buying.
The benchmark numbers from earlier give you the frame for that choice. Google Ads treats CTR as a visibility signal, and the CXL averages cited earlier show search at 6.64% and display at 0.57%. In email, the denominator split means click rate and CTR answer different questions, so a strong open-to-click rate does not make up for a weak delivery-to-click rate. Google Ads CTR definition, CXL benchmark page
What to optimize, and what to ignore
For search, improve CTR when the ad is missing intent even though the landing page already holds up. For display, treat CTR wins with caution unless post-click behavior improves too. For email, raise click rate when delivery is healthy but the list is not responding, then check CTR to see whether the message holds up after the open. HubSpot's email click metric distinction
For social, do not let a feed-friendly creative hide weak conversion quality. For landing pages, stop chasing clicks and focus on what happens after the click, because that is where the business result is usually decided. For early-stage SaaS, the better move is often to fix one bottleneck at a time instead of polishing every metric in parallel.
The bottleneck is usually the denominator you chose. If you measure clicks against impressions, you are judging exposure efficiency. If you measure clicks against deliveries or opens, you are judging how much of the audience engaged. If a metric can rise without improving revenue, it should not be the one running the team's weekly decisions. Use click rate to understand delivery response, use CTR to understand exposure efficiency, and use conversion rate plus CAC to decide whether the traffic is worth buying again.
If you want a team that can wire the whole chain together, from tracking and dashboards to paid media and lifecycle reporting, Du Marketing builds that system for startups that need answers, not dashboard theater. Visit Du Marketing if you want one operator to connect the clicks, the CRM, and the revenue story without the usual handoff chaos.