Conversion Funnel Analysis: A Startup Revenue Guide
Your dashboards don't agree, your paid media manager swears the leads are fine, and the CRM says half the “conversions” never existed. That's usually the moment a founder realizes conversion funnel analysis isn't a reporting exercise, it's a governance problem. If the events are messy, the numbers are folklore.
Table of Contents
When Three Dashboards Tell Three Different Stories
The founder looked at GA4 first. The campaign had a tidy-looking funnel, the usual drop between visit and signup, and a few suspicious gaps in the middle. Then HubSpot showed a different story, because some “signups” were duplicate contacts, and the sales team had manually cleaned the list. Meta made the whole thing look better again, because it was taking credit for assisted touchpoints the other systems weren't counting the same way.
That's the trap. Teams reach for conversion funnel analysis expecting a neat chart, but the first question is simpler, and harder, which system gets to define the event in the first place. If GA4, CRM, and ad platforms each own a different version of the truth, the funnel is already broken before anyone debates a headline or button color.
Practical rule: don't optimize a funnel you can't name consistently. Define the core actions first, then decide which system records them for decision-making.
The useful mental model is a sequence, not a dashboard. A founder needs a primary source for each stage, then supporting systems for validation. The point isn't to make every platform say the same number, because they won't. The point is to stop pretending mismatched numbers are all equally useful.
That's why conversion funnel analysis starts upstream of “what's the drop-off?” and lands on “what's the event taxonomy?” A signup in GA4, a created contact in HubSpot, and a conversion in Meta are not interchangeable just because they happened around the same time. Once those definitions drift, every downstream chart inherits the confusion.
A good internal dashboard helps, but only after the definitions are stable. If you're still shaping how events are labeled and counted, a reporting layer can't save you. A practical reference for building that shared reporting layer is the Looker Studio dashboard template guide, but the template only works after the measurement rules are settled.
Mapping Funnel Stages and Tying Metrics to Each Step
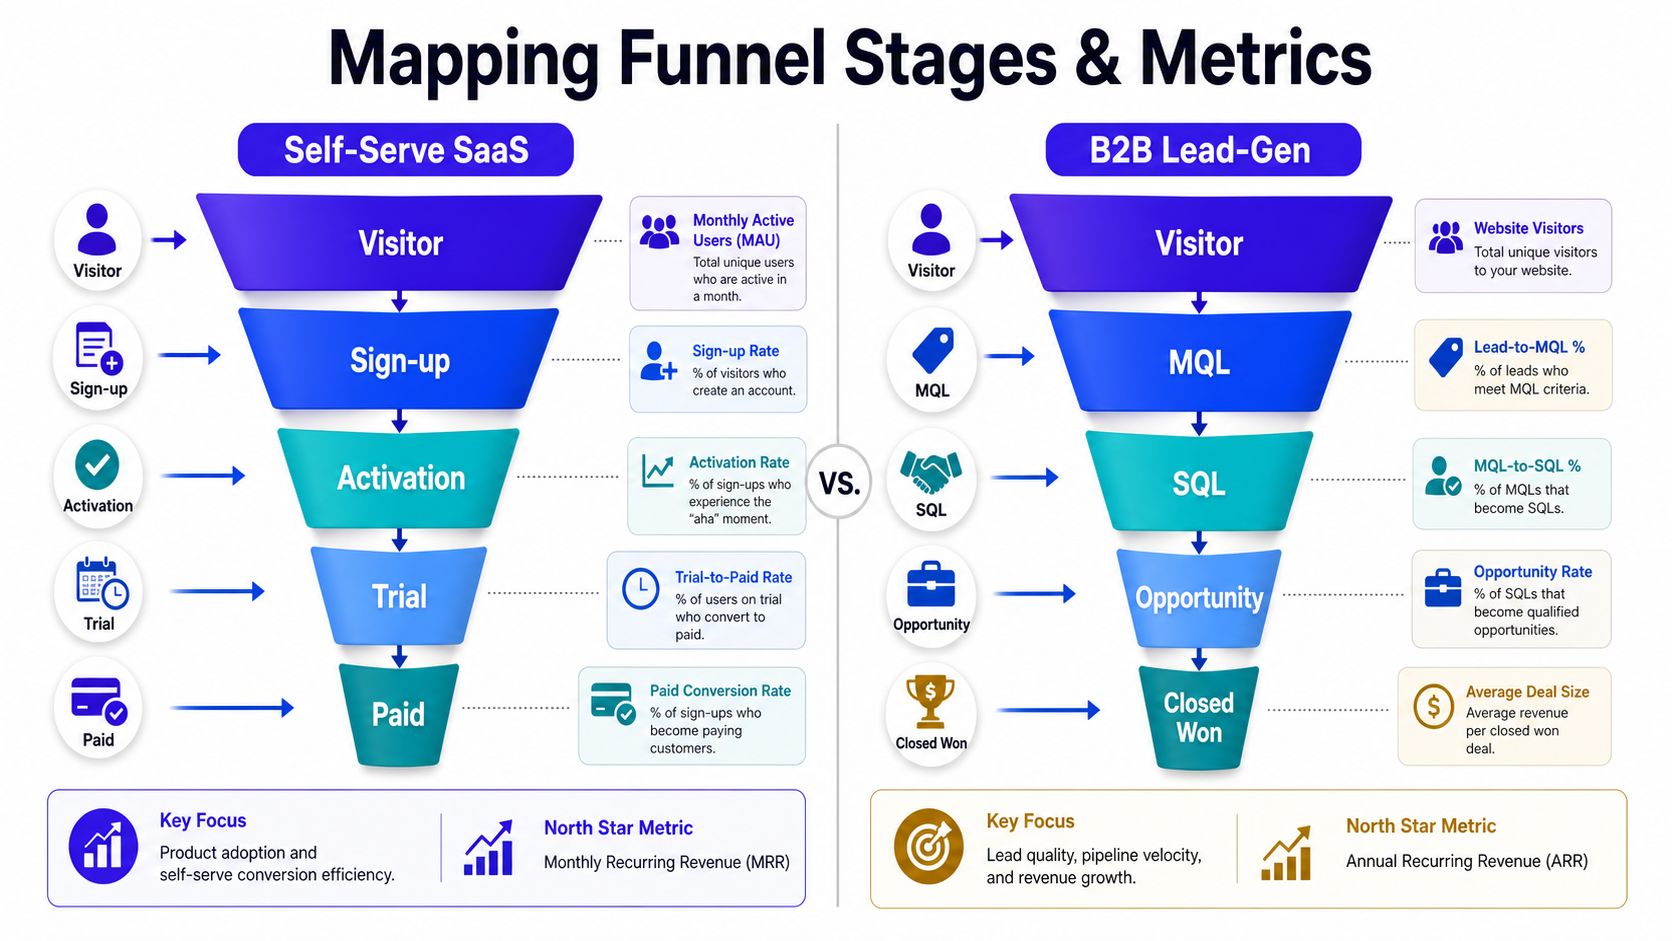
A funnel that's too abstract won't help you. A funnel that's too detailed becomes unreadable. The sweet spot is a one-page definition with ordered stages, named owners, and the exact transition you care about at each step.
Self-serve SaaS and checkout flows
For a self-serve SaaS product, the cleanest path is usually something like visitor, sign-up, activation, trial, paid. For ecommerce, it often looks more like product view, add to cart, checkout start, purchase. The common mistake is treating the total conversion rate as the main number. It isn't. Step-to-step conversion tells you where people stall, and time between steps tells you whether friction is immediate or delayed.
A SaaS founder should care about the transition from sign-up to activation more than the total number of visits, because that's where the first real proof of value usually happens. In a checkout flow, the best metric isn't just “purchases,” it's the transition from checkout start to purchase, because that tells you whether the final screen is doing its job.
Practical rule: if a stage doesn't change a decision or a workflow, don't call it a stage.
B2B lead gen needs different labels
A B2B funnel usually needs visitor, MQL, SQL, opportunity, closed-won. That looks simple until the sales team says a demo booked isn't always qualified, and the CRM says the opportunity isn't real until it's accepted. The funnel definition becomes a contract between marketing and sales, not just a visual.
The metrics belong to transitions, not vanity totals. Lead to MQL, MQL to SQL, SQL to opportunity, and opportunity to closed-won are the questions that matter. Add segmentation variables at the definition stage, not later, so the tracking plan already knows whether device, channel, campaign, country, plan, or account type matters.
A good one-page funnel definition includes:
Stage names that every team member recognizes.
Trigger event for each transition.
Primary metric for each step, usually step-to-step conversion.
Secondary metric such as time to convert or time in stage.
Segmentation fields that will be used later in reporting.
That document becomes the contract. Without it, reporting turns into translation work every month, and nobody knows whether the issue is real demand, lead quality, or just a bad definition.
Building the Tracking Stack So the Funnel Is Audit-Ready
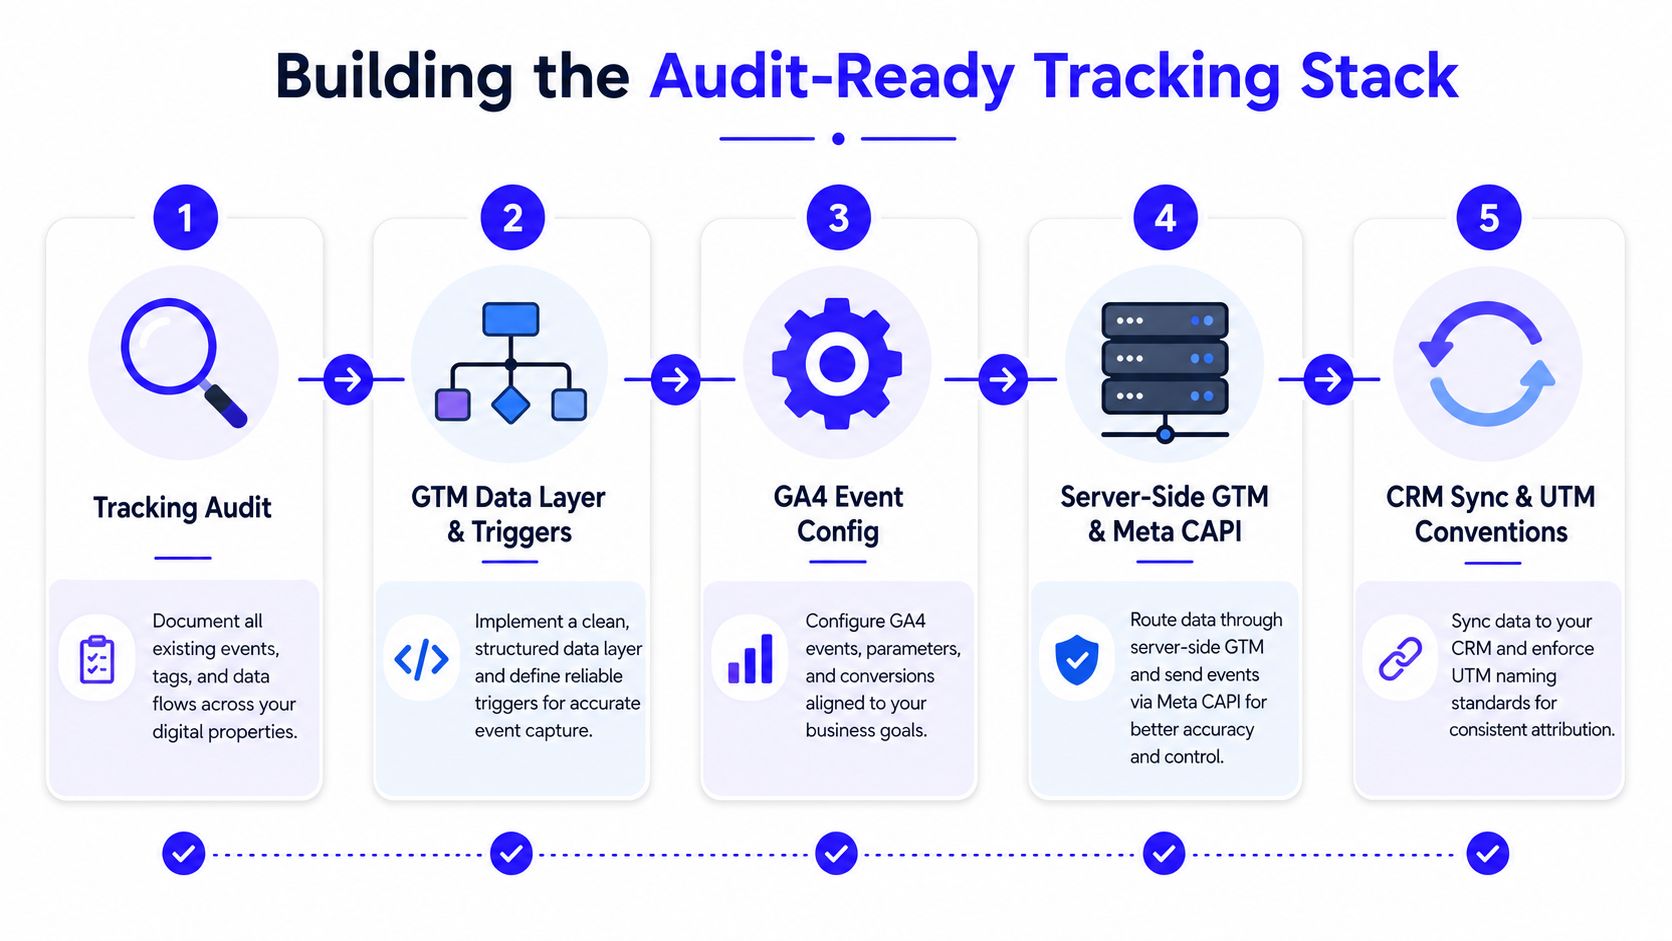
A funnel isn't trustworthy until the tracking stack is auditable. That starts with a tracking audit, because you can't fix missing events by staring harder at a dashboard. It continues through the layers that move data from user action to decision: tag manager, analytics, server-side collection, CRM sync, and offline revenue mapping.
Build the spine before the polish
Start with Google Tag Manager and a clean data layer, because messy front-end events are the easiest way to poison the funnel. Then configure GA4 events so every core action is named the same way across pages, campaigns, and product flows. If the event names change from one screen to the next, the analysis will drift before it ever reaches a meeting.
Server-side GTM and Meta CAPI aren't optional decoration anymore for teams dealing with privacy constraints and signal loss. For European traffic in particular, consent mode v2 and first-party data recovery make server-side capture a practical necessity rather than a nice-to-have. If you skip this layer, ad platforms start undercounting, and you're left arguing over whose dashboard lost the user.
The CRM layer matters just as much. HubSpot or Pipedrive should receive the lifecycle stage, not just the lead record, so pipeline reporting can be reconciled against web activity. Offline conversion uploads then close the loop when deals move outside the browser and back into sales.
Practical rule: if a conversion can happen after the browser session ends, the browser can't be your only source of truth.
For a startup, the build order should follow risk, not convenience. Fix the event map first, because everything else depends on it. Then stabilize GA4 and CRM sync. Only after that should you expect a useful view from CAPI, ad-platform uploads, and closed-loop revenue reporting.
If you want a practical explanation of why server-side tracking changes attribution quality, the server-side tracking guide is the right companion piece. The core idea here is simpler, though, the stack has to survive consent loss, platform-side attribution differences, and sales-cycle delays without falling apart.
QA checks that actually catch drift
Don't trust a tracking rollout until the events reconcile in live testing. Click the action, confirm the event fires, confirm the CRM record appears, then confirm the ad platform receives the conversion later if that's part of your setup. If one layer fires and another doesn't, you don't have a funnel yet, you have a partially wired story.
Finding Real Drop-Offs Across Cohorts and Channels
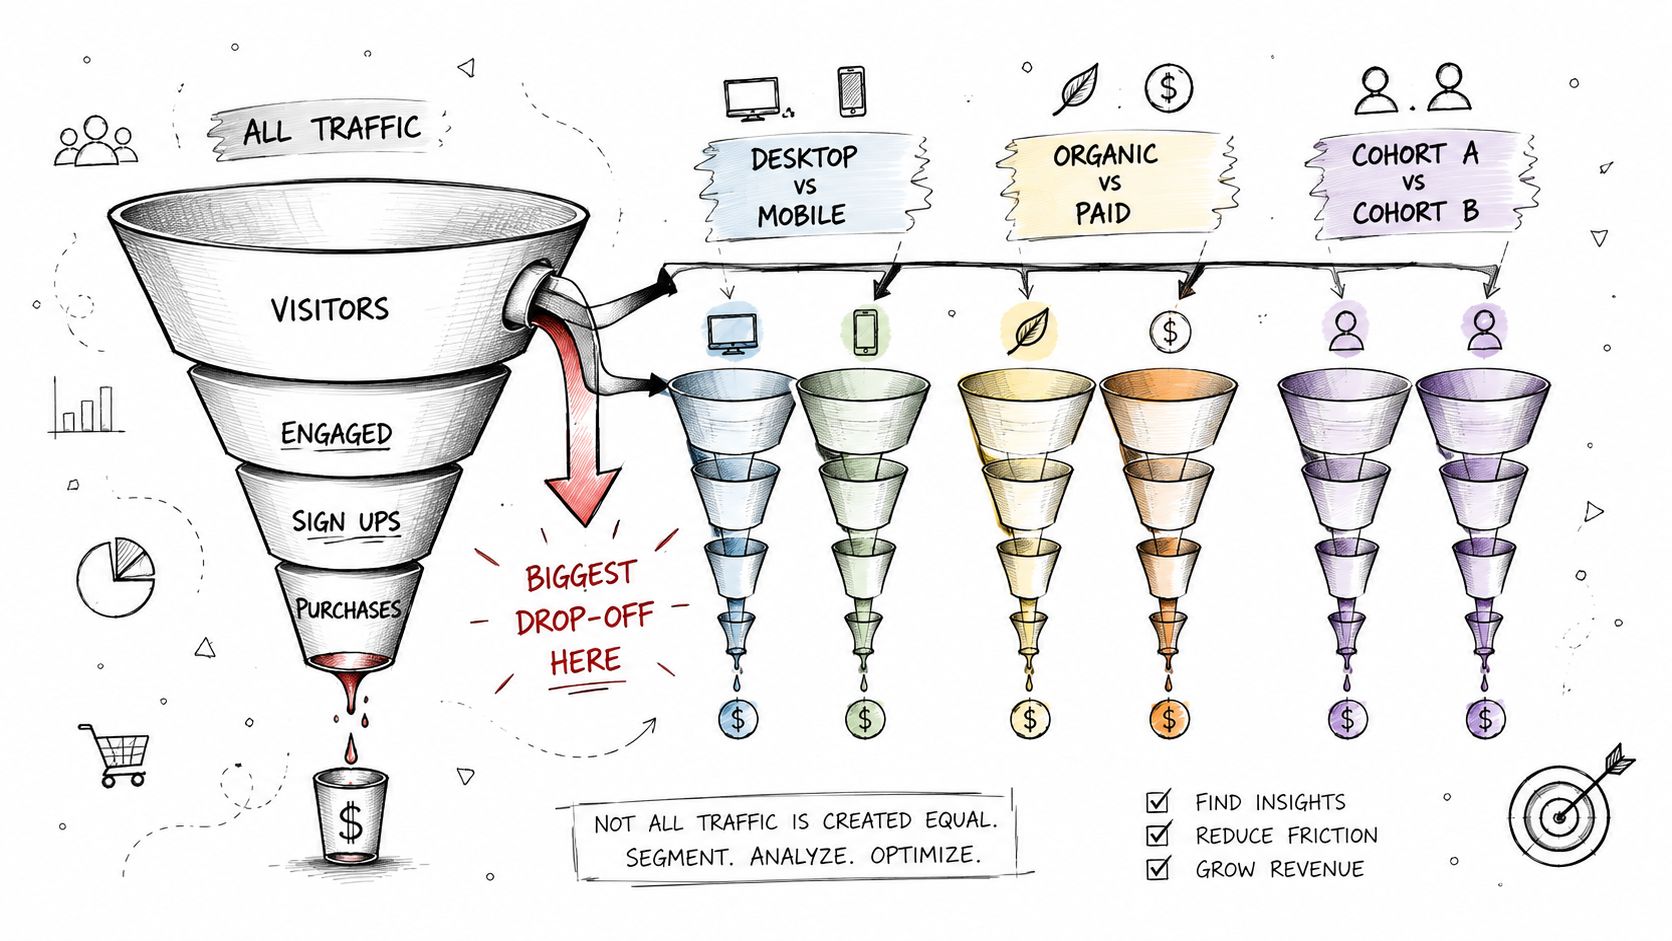
The first funnel chart usually lies by omission. It shows the average, which is the least interesting number in the room when one device, one campaign, or one cohort is carrying most of the pain. The work starts when the aggregate number gets broken apart.
Segment before you accuse the funnel
Slice by device, source, campaign, country, plan tier, and signup cohort. A broad conversion rate can hide a mobile issue, a low-quality paid source, or a cohort that entered before a product change. The goal is not more reporting noise. It's enough separation to see which segment is leaking.
The common mistake is starting with the biggest-looking drop-off in the aggregate view. That's often the wrong place, because one small but high-volume channel can distort the whole picture. Another common failure is stopping at last-click attribution, which makes research-heavy, multi-touch journeys look cleaner than they are.
Time to conversion belongs in the same conversation
For B2B and considered purchases, a slow funnel isn't automatically a broken funnel. Some buyers research across multiple sessions, revisit the site, and only convert after several touches. In those cases, time to conversion is as important as the drop-off rate, because the problem might be timing, not friction.
The question isn't always “where did they abandon?” Sometimes it's “did they leave, or are they still deciding?”
That's why cohort views matter. New users often behave differently from returning users, and paid cohorts often behave differently from organic ones. If you only look at a blended rate, you'll miss the segment that's driving the outcome.
The best diagnostic pattern is repetitive:
Funnel view: locate the step with the biggest visible loss.
Segmentation view: split that step by device, channel, cohort, and campaign.
Cohort view: compare users by signup date or entry point to see whether the issue is structural or temporary.
Once those three views line up, the leak usually stops being mysterious. The aggregate chart says something is wrong. The segmented view tells you who is affected. The cohort view tells you whether the issue is current, historical, or tied to a specific acquisition source.
Choosing One Source of Truth When the Numbers Disagree
A startup running paid social, email nurture, and offline sales can't afford to average mismatched numbers and call it strategy. That habit just hides the attribution problem under a friendly-looking midpoint. If GA4 says one thing, the CRM says another, and Meta says a third, the right move is to assign ownership to each stage instead of trying to make the systems agree by force.
Who owns what
Use GA4 for on-site behavior and step-level web journeys. Use the CRM for lifecycle progression, pipeline stage, and revenue. Use ad platforms for directional read on delivery, reach, and platform-reported conversion influence, but not as the final judge of the funnel.
That division sounds rigid until you try the alternative. If the CRM is allowed to define a signup, the web team loses visibility into actual form completion. If GA4 is allowed to define closed-won, sales history gets flattened into a browser event. Each system is right inside its lane and misleading outside it.
For most startups, the primary rule is simple. The system that records the earliest reliable proof of the action owns that stage, and the others support it. A demo booked belongs in the CRM if sales schedules it there. A checkout completion belongs in GA4 if it happens on-site and is captured reliably there. A closed deal belongs in the CRM, because that's where revenue is negotiated and confirmed.
Reconciliation beats averaging
The point of reconciliation is not to find one magical number that all tools share. It's to explain why the numbers differ well enough that the team can act. If a channel looks weak in Meta but strong in the CRM, that may reflect platform attribution limits rather than bad demand. If GA4 records a conversion that never reaches the CRM, that's not a marketing win, it's a data integrity issue.
Pick a rhythm and keep it. Review discrepancies weekly, not monthly, so drift gets caught while the memory of the campaign is still fresh. Ask three questions every time: which system owns the stage, which system is supporting it, and what changed since the last clean period.
If the team can't explain the gap, the gap is the story.
That's the side worth taking first. Don't redesign the page until the event definitions and stage ownership are stable. Otherwise you're testing creative against a measurement problem, and the result will look scientific while saying nothing useful.
Designing Experiments That Actually Move the Funnel
A good funnel finding should become a narrow experiment, not a vague brainstorm. The best teams don't ask, “How do we improve conversion?” They ask, “Which step is failing, what do we think is causing it, and what would count as a real improvement?” That keeps tests tied to evidence instead of taste.
Match the test to the problem
Page-level A/B tests work when the friction sits on a specific page or screen. Funnel-level sequencing tests make more sense when the issue is timing, like email before retargeting or retargeting before email. Product experiments belong in activation or onboarding when the bottleneck is the first meaningful action, not the marketing entry point.
The trap is running tests while the instrumentation is still unstable. If the event definitions are drifting, a “win” may just be a tracking artifact. The second trap is celebrating micro-metric movement that doesn't reach revenue. A button click means nothing if the downstream step stays flat.
Write the decision rule before launch
A useful experiment brief fits on one page:
Hypothesis: one step, one cause, one expected change.
Test design: holdout, pre/post, or split test.
Success metric: the specific step-to-step conversion or time-to-conversion that matters.
Decision rule: what result makes the team ship, iterate, or stop.
That structure helps founders stay honest. If the hypothesis says checkout start is the problem, the test should target checkout start. If the metric says revenue matters, a lift in form submissions alone won't qualify. And if the funnel is delayed, the decision rule should include enough wait time for the conversion to mature.
For landing page work, the landing page conversion optimization guide is a useful companion. The discipline is the same across channels, though, a test is only as good as the step it's trying to move.
Useful shortcut: don't run broader tests when a single leaky transition is already obvious.
That's where the comparison with GA4, CRM, and ad-platform numbers matters again. If the web layer says the page improved but the CRM says pipeline didn't budge, the test didn't solve the business problem. It solved a proxy.
From Funnel Findings to Acquisition and Lifecycle Wins
The endgame isn't a prettier funnel chart. It's a weekly operating system that turns the findings into budget moves, lifecycle moves, and clearer decisions. Once the funnel is defined and the numbers are trustworthy, the team can stop debating whether a drop is real and start deciding what to do about it.
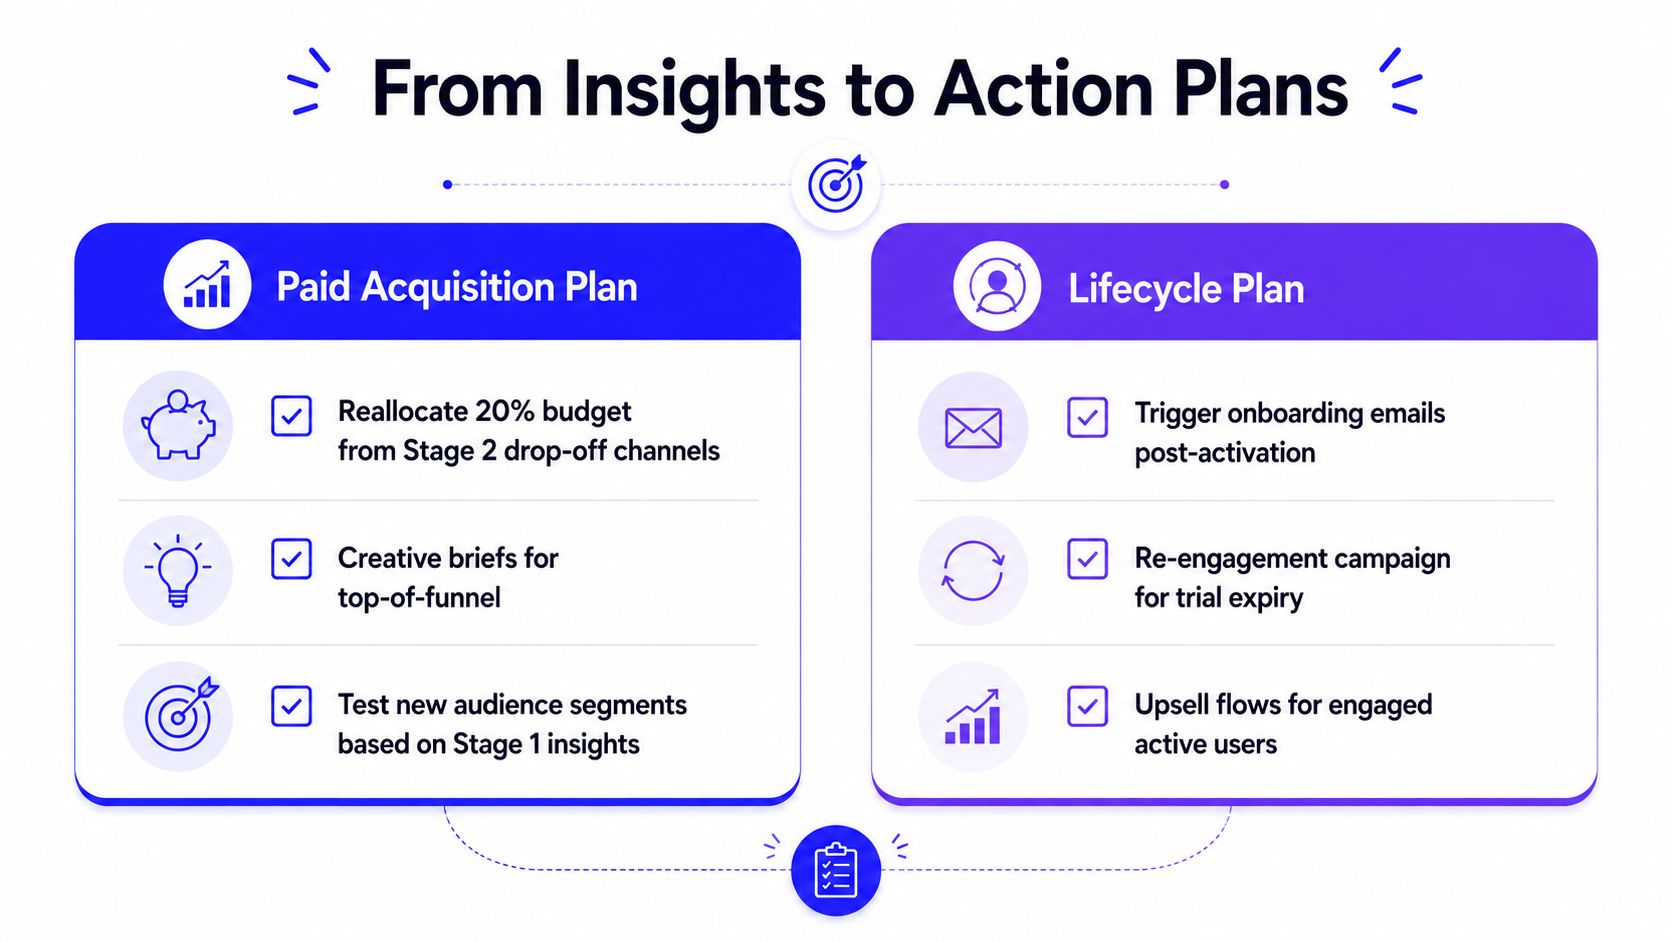
Paid acquisition needs stage-level logic
Budget reallocation should follow the stage where losses are concentrated, not the channel that looks loudest in a platform report. If a campaign drives traffic but fails at activation, the creative and landing page need attention before you scale spend. If one source brings qualified users farther into the funnel, it deserves more budget even when it looks expensive at click level.
Creative briefs work better when they reference a funnel stage instead of a general brand mood. Top-of-funnel assets should be judged on the quality of the next step, not just views or clicks. Mid-funnel assets should support consideration and return visits. Bottom-funnel assets should remove hesitation and shorten the path to action.
Lifecycle work turns leak points into follow-up
Lifecycle fixes often outperform cosmetic page changes because they meet users where they drop. If the issue appears after activation, onboarding emails can carry users to the next step. If the gap is in a trial or demo sequence, re-engagement should target the exact point where intent cools off.
The reporting cadence should be just as disciplined. Daily checks catch obvious breakage, weekly reviews focus on the funnel steps and campaigns under pressure, and monthly reviews are where the broader trend line gets read. Looker Studio is useful here because the funnel definition, once stabilized, becomes a shared view instead of a private spreadsheet ritual.
A few questions that come up fast
How often should the funnel definition be re-validated?
Whenever the product flow changes, the CRM stage logic changes, or a new channel enters the mix. If those things haven't changed, review it on a regular cadence so drift doesn't sneak in.
When should a stage be added or removed?
Add a stage when it changes a decision. Remove it when it doesn't help separate one kind of loss from another.
What about funnels with delayed conversion?
Use time-to-conversion, micro-conversions, and stage ownership in the CRM, then judge the funnel over a longer window instead of forcing a same-day conclusion.
What if one channel and one cohort produce most of the revenue?
Protect that path first, then test expansion elsewhere. A concentrated revenue engine isn't a flaw by itself, it's a signal to keep the core motion healthy before broadening the mix.
If you want this turned into a working funnel, not just a slide deck, Du Marketing can help you define the stages, reconcile the tracking, and connect the numbers to actual acquisition and lifecycle decisions. Visit Du Marketing if you want a single operator to build the measurement, reporting, and optimization system with you.